Modeling for food ingredient detection
and freshness analysis
Summary
This project developed a core model for a food ingredient sharing service by rapidly detecting individual food ingredients from composite images and accurately classifying their freshness. We built and fine-tuned datasets of single food ingredient images (over 69,000) and composite images (over 12,000) using YOLO_V8, achieving detection accuracies above 90% for most labels with automatic cropping via an open-source computer vision library. Then, using an identical architecture based on DenseNet, GoogleNet, and ResNext, we extracted freshness-related features and classified them with individual MLPs followed by a final MLP classifier using SoftMax scores. This approach achieved high accuracies—99.8% for meat, 99.6% for fruit, and 97% for vegetables—and demonstrated excellent generalization on randomly collected images.
Role
As a member of the model development team, I was specifically responsible for food ingredient image collection and improving the performance of the detection model.
Goal
The goal of this project is to propose a food ingredient sharing service that supports healthy eating for individuals living alone and addresses the issue of food waste. To achieve this, we focused on developing a core model that rapidly detects individual food ingredient objects from composite images and accurately classifies their freshness.
Process
Overall Pipeline Overview
When a composite image of food ingredients is input, the overall pipeline is divided into two main stages. The first stage is Food Ingredient Object Detection, which swiftly and accurately detects each food ingredient object in an image containing multiple items. The second stage is Freshness Classification, which precisely categorizes the freshness of each detected food ingredient object. This project was initiated to support healthy eating habits for individuals living alone through a food ingredient sharing service and to address food waste issues, focusing on developing the core models that will form the service.
1. Food Ingredient Object Detection
Food Ingredient Object Detection
Previous studies have trained models on fewer than 10,000 images and limited food ingredient categories, limiting scalability and practicality in real-world environments. To overcome this, we utilized public image dataset platforms such as Roboflow to select over 40 food ingredient labels (e.g., apple, banana, cucumber, carrot, potato, onion, chicken, pork, etc.) commonly encountered in daily life.
- Single Food Ingredient Dataset
This dataset contains images with only one food ingredient per image. We collected over 69,000 high-resolution images to enable the model to learn the unique visual features of each ingredient. - Composite Food Ingredient Dataset
Reflecting real-world scenarios, we secured over 12,000 images in which multiple food ingredients are mixed in a single image, thereby enabling high detection performance even in complex backgrounds with overlapping objects.
Model Training and Stepwise Fine-Tuning
First, we fine-tuned the YOLO_V8 model using the single food ingredient dataset to focus on single-object detection. During this process, the model effectively learned the basic visual features and achieved an accuracy of approximately 92%.
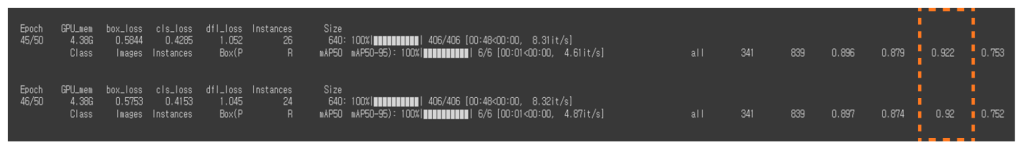
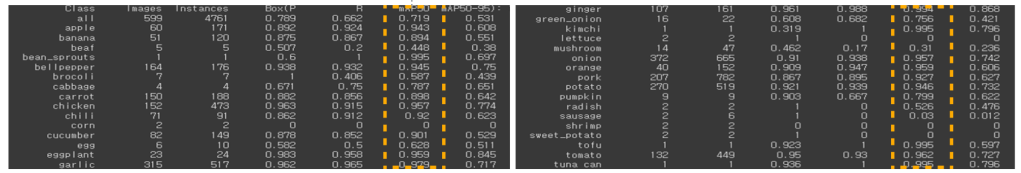
Based on the hypothesis that, similar to how humans learn sequentially from simple to complex concepts, deep neural networks become more refined when they sequentially learn from basic to complex visual features, we used the model optimized for single food ingredient detection as the initial weights and conducted further fine-tuning on the composite food ingredient dataset. As a result, for most labels—except for a few such as beef, mushrooms, and sausages—we achieved detection accuracies of over 90%.
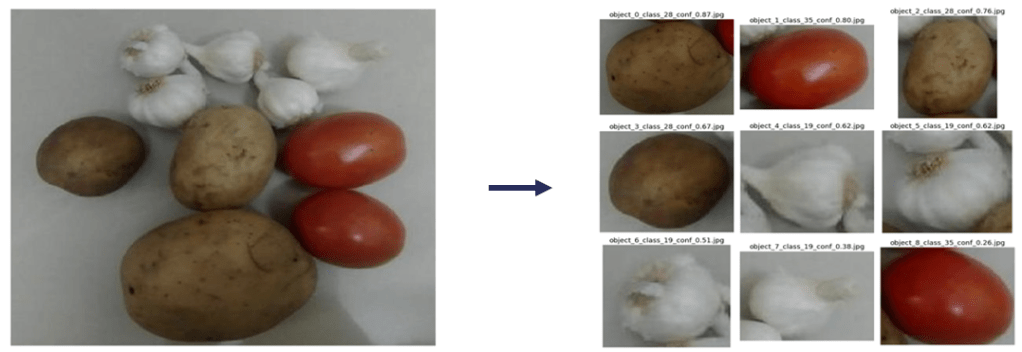
Post-Processing: Object Cropping
An algorithm for cropping each detected object was built using an open-source computer vision library. This ensures that the separated individual food ingredient images are seamlessly passed on to the Freshness Classification stage.
2. Freshness Classification
Analysis of Visual Characteristics by Food Ingredient Type
Food ingredient groups (e.g., meats, vegetables, fruits, etc.) exhibit clearly distinguishable visual characteristics when fresh versus when spoiled. Based on these visual differences, we confirmed the need to develop specialized freshness evaluation models for each food ingredient group.
- Meats
Fresh meat displays a vivid red color with a glossy surface, and its fat appears white or cream-colored, whereas spoiled meat shows darkened, discolored, and slimy surfaces. - Vegetables and Fruits
Fresh vegetables and fruits maintain a firm, uniform color and texture, while spoiled ones develop wrinkles, dryness, and a faded, browned appearance.
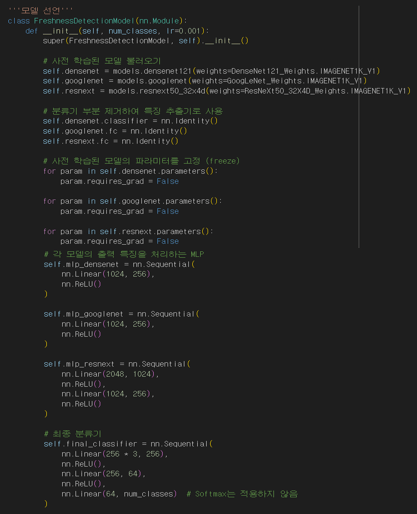
Model Architecture and Fine-Tuning Strategy
The architecture applied to all three freshness detection models is identical. Specifically, for the same food ingredient image, three pre-trained and fine-tuned Convolutional Neural Networks—DenseNet, GoogleNet, and ResNext—extract features of dimensions 1,024, 1,024, and 2,048 respectively. These features are then passed through individual MLPs to generate three 256-dimensional feature vectors. The vectors are concatenated to form a 768-dimensional feature, which is fed into a final MLP Classifier Network that outputs linear scores for each freshness class. Finally, the SoftMax Activation Function is applied to yield probability scores for each class, with the class having the highest probability selected as the final prediction result.
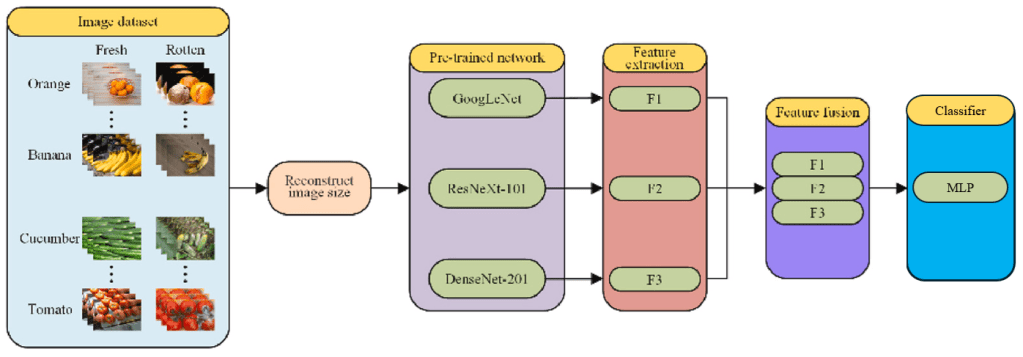
Additionally, this architecture is designed to be easily scalable; if new food ingredient labels are added, only the number of nodes in the output layer needs to be adjusted.
Dataset Composition and Training Results
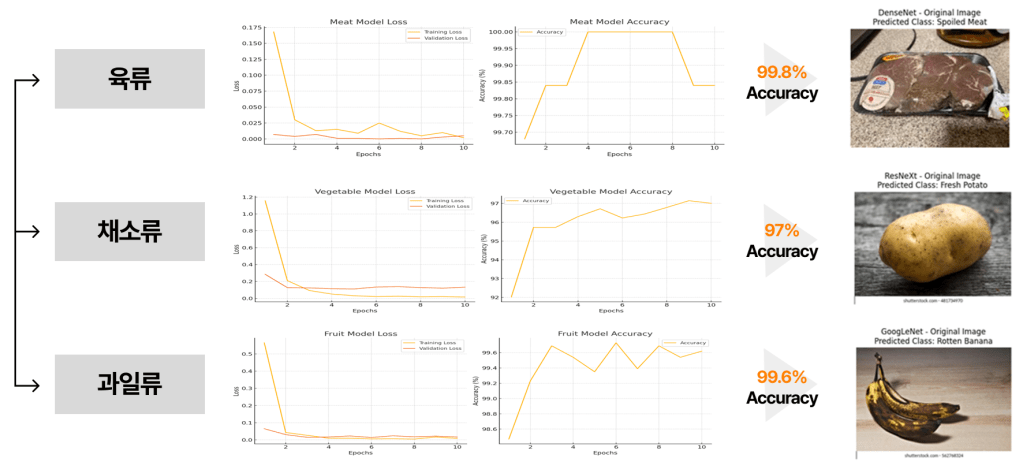
Among the over 40 labels obtained during the object detection phase, we selected 11 labels with sufficient image data for freshness evaluation and trained the freshness classification models on them. Training was conducted over 3 epochs, and the test set achieved the following high accuracies:
- Meat Freshness Classification: Using 6,284 images of Fresh Meat and 5,324 images of Spoiled Meat, we built a binary classification model that achieved 99.8% accuracy.
- Fruit Freshness Classification: Using a total of 5,499 images for fresh variants (Fresh Apple, Fresh Orange, Fresh Banana, Fresh Tomato) and 6,772 images for rotten variants (Rotten Apple, Rotten Orange, Rotten Banana, Rotten Tomato), we performed an 8-way classification model that recorded 99.6% accuracy.
- Vegetable Freshness Classification: Using 4,111 images of fresh vegetables (Fresh_Potato, Fresh_Carrot, Fresh_Bellpepper, Fresh_Lettuce, Fresh_Onion, Fresh_Cucumber) and 4,335 images of their rotten counterparts, we trained a 12-way classification model that achieved 97% accuracy.
Furthermore, the model demonstrated very high performance on food ingredient images randomly collected from the internet, confirming that it was not overfitting solely to our dataset.
Interpretability
Explainability of the Using G-CAM
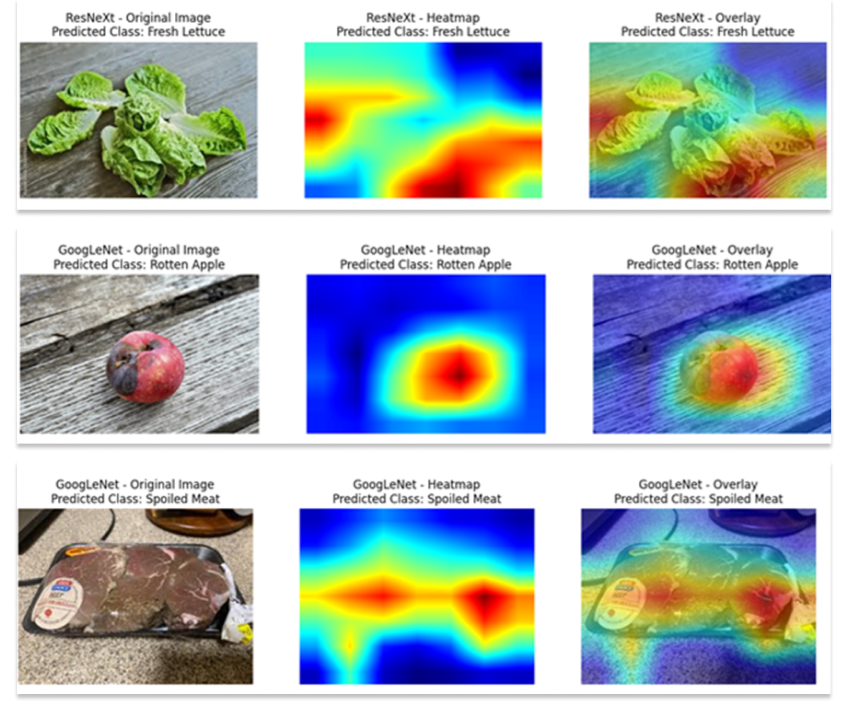
From the perspectives of Explainable AI and Human in the Loop AI, we applied the Gradient CAM (G-CAM) technique to secure the explainability of our CNN. This method calculates the importance of each feature based on the gradients of the predicted Linear Class Score with respect to the high-dimensional Feature Map obtained from the CNN’s last convolution layer, thereby generating a Class Activation HeatMap of size H×W. By interpolating and overlaying this HeatMap to match the size of the original image, we were able to clearly visualize which visual features the model relied on for its decision-making. By integrating three fine-tuned networks—DenseNet, GoogleNet, and ResNext—we confirmed that various visual features such as background, objects, fresh areas, spoiled areas, and damaged areas can be effectively extracted.
Visualization of High-Dimensional Features Using T-SNE
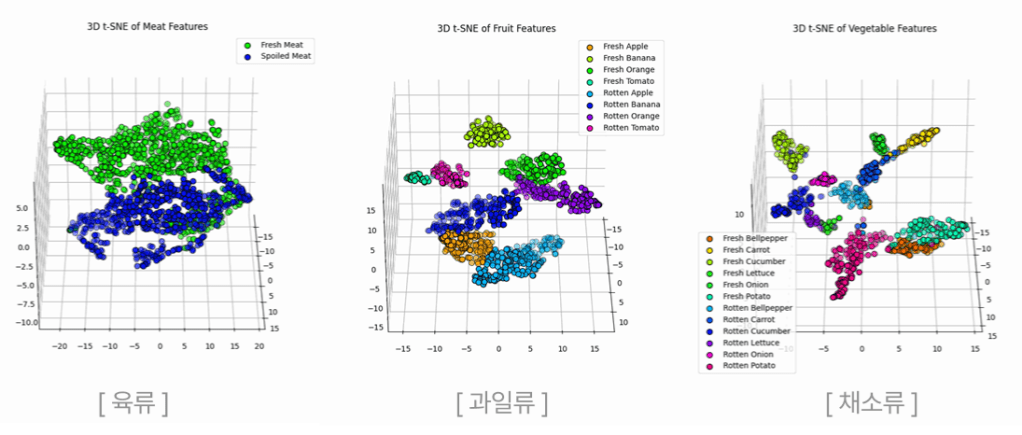
To effectively project data from the high-dimensional Feature Space into a lower-dimensional space for visualization, we applied the non-linear dimensionality reduction technique T-SNE. T-SNE calculates the similarity between each data point in the high-dimensional space using a Gaussian distribution, and in the low-dimensional space, it recalculates the similarity using a T-distribution, operating by minimizing the Kullback-Leibler Divergence between the two distributions. As a result of projecting the 768-dimensional Feature Space used for final classification into three dimensions, we were able to confirm that the visual features related to freshness for each food ingredient group—such as meats, vegetables, and fruits—form clear clusters, thereby proving that the model has learned meaningful features.
In conclusion, we secured the explainability of our model by applying G-CAM and T-SNE to the CNN and MLP across our entire pipeline, thereby demonstrating its practicality in the sensitive domain of food products.
